FIELD NOTE · 2025-06-24
How to remove cell-cycle effect in single cell RNA sequencing?
When working with a scRNA-seq dataset, the first thing we typically do is clustering.
For well-behaved datasets, we often assume that proper quality control (QC) and batch effect correction have already been done. But there's one important factor that often gets overlooked—or intentionally ignored—during preprocessing: Cell cycle.
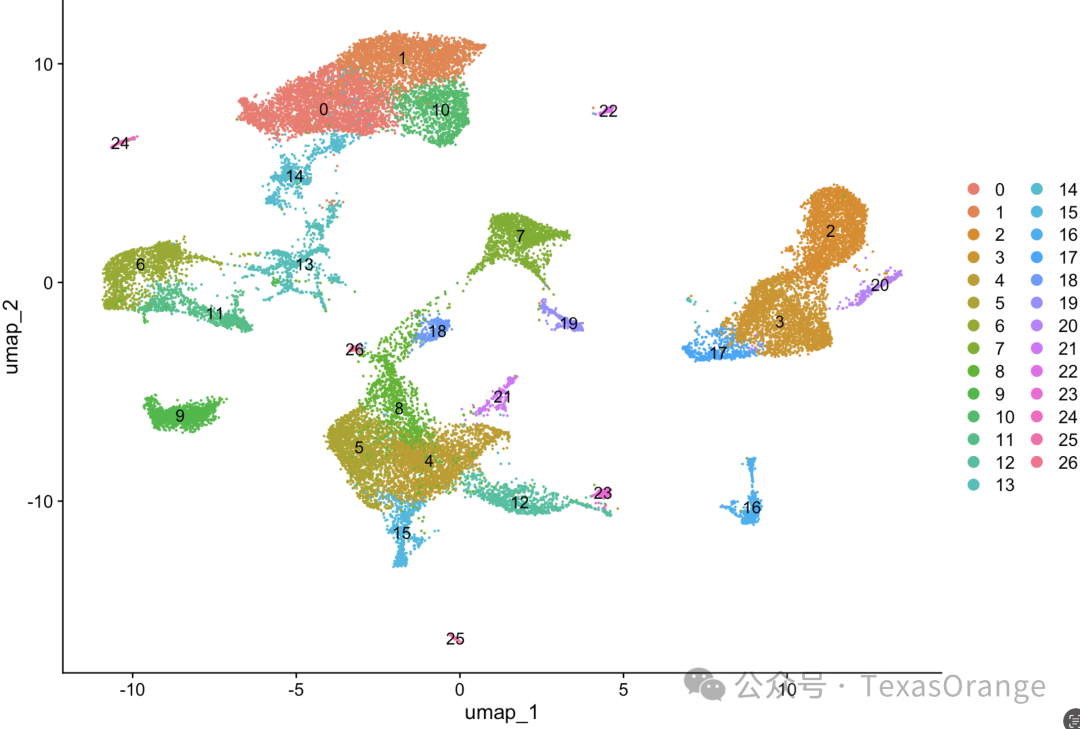
After clustering, you might notice that some clusters appear “blurry” or inconsistent, especially around the borders. (figure below.) This kind of messiness can affect the biological interpretability and reliability of your results.
Should You Remove Cell Cycle Effects?
Not always. If your research focuses on proliferation, such as in cancer, development, or stem cell biology, then you may not want to regress out the cell cycle effects. But if your goal is to identify cell types or states without the confounding influence of proliferation, then removing the cell cycle effect is necessary.
The basic idea is: Exclude cell cycle–related genes from PCA, which in turn affects your dimensionality reduction and UMAP clustering.
Methodology in Seurat
Good news: you don’t need to install any new packages. The function CellCycleScoring() is built into Seurat, so no compatibility nightmares.
いただきます!
1. Standard Preprocessing
Assuming you’ve already done QC:
combined <- NormalizeData(combined)
If you’re working with multi-sample datasets, apply integration:
combined <- IntegrateLayers(
  object = combined,
  method = CCAIntegration,
  orig.reduction = "pca",
  new.reduction = "integrated.dr",
  verbose = FALSE
)
Do the integration first, then cell cycle scoring.
2. Cell Cycle Scoring
Seurat comes with a built-in list of cell cycle genes (cc.genes.updated.2019). But they're in all-uppercase, which can cause mismatches with your dataset. Here’s a small utility to fix that:
s.genes <- cc.genes.updated.2019$s.genes
g2m.genes <- cc.genes.updated.2019$g2m.genes

# Built-in lists are all-uppercase; convert to Title Case to match your dataset
s.genes <- stringr::str_to_title(s.genes)
g2m.genes <- stringr::str_to_title(g2m.genes)
Now score the cells:
combined <- CellCycleScoring(
  object = combined,
  s.features = s.genes,
  g2m.features = g2m.genes,
  set.ident = TRUE
)
You’ll now find S.Score, G2M.Score, and Phase metadata in your object:
head(combined[[]])
Plot the expression of cell cycle markers to visualize:
RidgePlot(combined, features = c("Pcna", "Top2a", "Mcm6", "Mki67"), ncol = 2)
And see how the cell cycle influences your PCA:
combined <- RunPCA(combined, features = c(s.genes, g2m.genes))
If cells at different stages of the cycle aren't uniformly distributed, cell cycle effects are influencing your data, and you should remove them.
3. Regress Out Cell Cycle Effects
Now we remove those effects by regressing out S.Score and G2M.Score:
combined <- ScaleData(combined, vars.to.regress = c("S.Score", "G2M.Score"), features = rownames(combined))
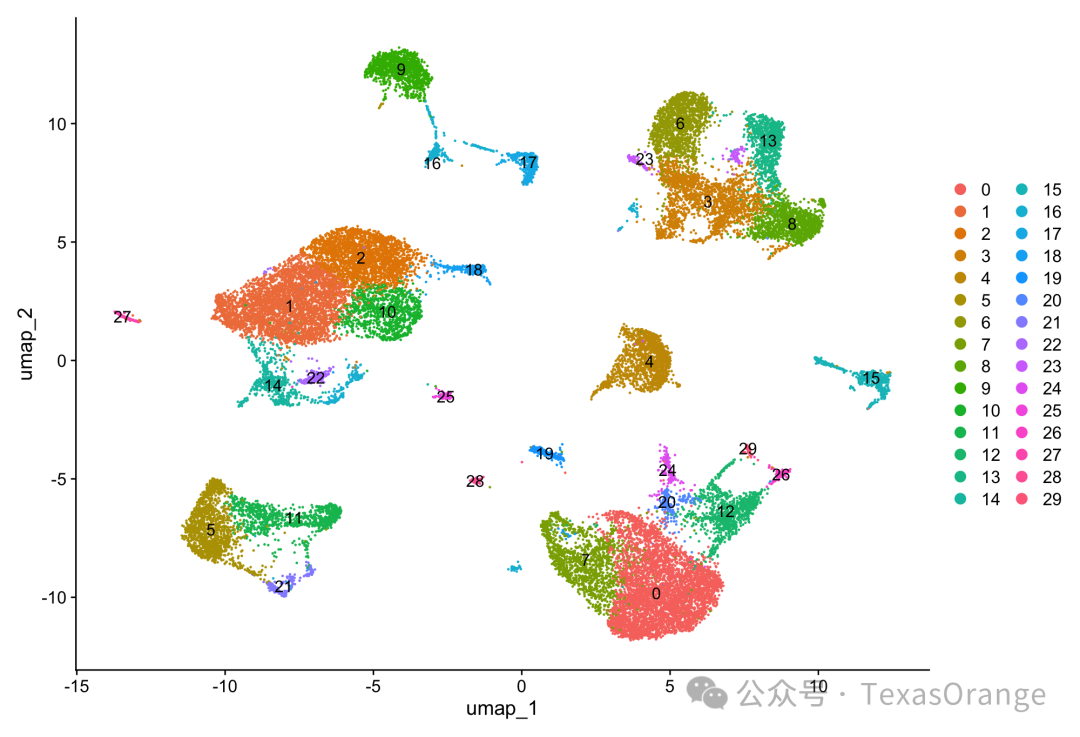
Now, the cells should be evenly distributed regardless of cell cycle phase.
4. Run UMAP and Clustering
Important: Use the “pca” reduction, not “integrated.cca”, if you'd like to keep orignial (or similar) umap. Sometimes, umap based on PCA analysis may look weird.
ElbowPlot(combined, ndims = 50)
Compare to your initial clustering: cell types are now more clearly separated without the noise from proliferation!
Final Thoughts
Removing cell cycle effects is a crucial but often forgotten step in scRNA-seq analysis. Don’t let a handful of proliferating cells throw off your interpretation. If your project doesn’t specifically involve cell cycle biology, do yourself a favor—clean it up before jumping into clustering and downstream analysis.
评论区